【7月17日黄金交易计划】PPI数据即将公布,市场面临关键拐点【7月17日黄金交易计划】PPI数据即将公布,市场面临关键拐点 📰 基本面分析: 今日重点关注美国将公布的PPI(生产者物价指数)关键数据。 根据专家预测,由于特朗普政府即将于8月1日正式实施新一轮关税,7月与8月的通胀水平可能明显上升。 在这种背景下,美联储(Fed)短期内很可能不会急于降息,这将直接影响市场情绪与黄金波动。数据公布前后,需密切关注价格行为及波动风险。 📉 技术面分析:BC调整浪仍在进行中 黄金目前处于BC调整浪结构中,尚未确认已完成结构。从经典的ABC浪结构来看,C浪应包含5个下行子浪,但目前仅看到3浪,仍有可能出现一波“诱空式下杀”。 以下是今日重点关注的关键价格区做多由AlexXxScalper提供
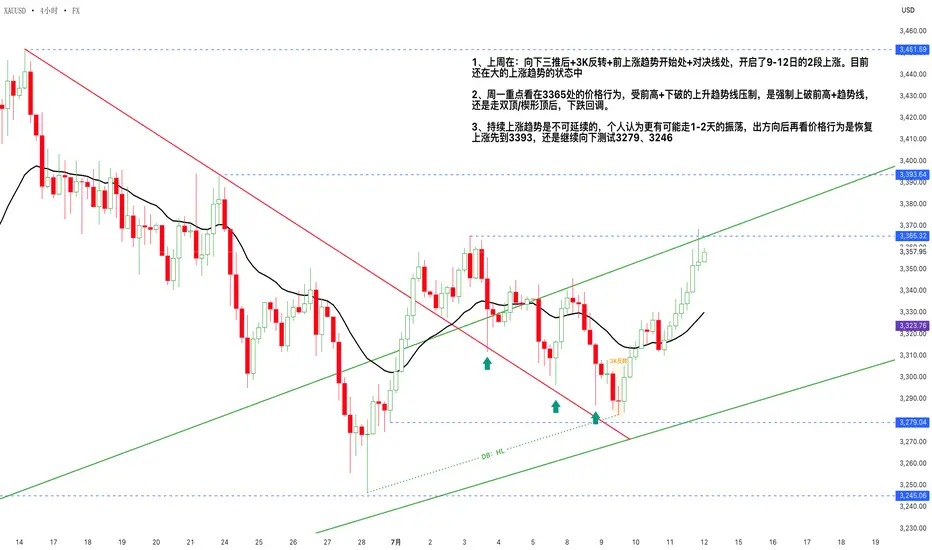
黄金这两天务追高,耐心等振荡后的方向,再跟进1、上周在:向下三推后+3K反转+前上涨趋势开始处+对决线处,开启了9-12日的2段上涨。目前还在大的上涨趋势的状态中 2、周一重点看在3365处的价格行为,受前高+下破的上升趋势线压制,是强制上破前高+趋势线,还是走双顶/楔形顶后,下跌回调。 3、持续上涨趋势是不可延续的,个人认为更有可能走1-2天的振荡,出方向后再看价格行为是恢复上涨先到3393,还是继续向下测试3279、3246由irisyan777提供
加速之后,真正的“主升浪”才刚开始?大家好,我是EC。 最近几天,BTC接连突破历史新高,行情开始加速,市场情绪也随之高涨。很多人可能会恐高,或者认为趋势已到末期。 但如果一直关注我的宏观框架,就会明白,这可能不是终点,而是“全市场共振”的正式开场。 在6月25日,我发布了一篇“预告篇”—— 《美元主线之下:下一轮全市场共振,准备好接球了吗?》。 观点链接: 当时我提出,如果美元、人民币、A股、欧元、比特币这些关键坐标依次触发共振信号,一场跨市场的大机会或许正在逼近 。 今天,我们就来复盘一下,这个剧本是如何一步步实现的。 一、 方向盘:美元的结构性走弱 一切的起点,是 美元这个“方向盘”。我在之做多由EC-M提供
EURGBP的加速:当新闻成为结构的“确认键”(07月02日)EURGBP 4小时级别截图:2025年07月02日21:23 今天市场的走势,为我们提供了一个观察“结构”与“新闻”关系的绝佳样本。 一、 剧本回顾:0.82的生命线 让我们先回到6月18日的观点《EURGBP:0.82生命线之上,多级别共振驱动主升浪》 链接:https://cn.tradingview.com/chart/EURGBP/bktb8Zep/ 当时,我的核心判断是:0.82已成为EURGBP新一代的结构生命线。 过去三年,市场在这个位置反复验证了支撑的有效性。每一次回踩,都被多级别共振的买盘迅速承接。这背后不是情绪,而是清晰的资金偏好和结构底气。我的结论是:做多由EC-M提供
美元主线之下:下一轮全市场共振,准备好接球了吗?这是一篇“预告篇”——如果接下来美元、人民币、A 股/港股、欧系货币、比特币这些关键坐标依次触发共振信号,那么一场跨市场的大机会或许正在逼近。 —————————————— 1. 先看方向盘:美元(USDCNH) 月线图 提示:今年04月09日 7.40 历史高点附近构筑顶部,5 月以来随美元贬值主线持续回落,当前 7.17 一线仍在下移通道中,未来 2–3 个月向 7.00 附近逐步下探的概率加大。 启示: 美元弱 → 人民币强 ,为境内外人民币资产打开估值上修空间。 观点和链接:《美元贬值主线复盘 | EURUSD节奏全纪录与最新变化(6月19日)》 0做空由EC-M提供
xauusd观察思路记录昨夜老鲍的国会发言,让xauusd一度打到3295,期金打到3300关口附近。 在3300最小观察仓介入,目前在3330附近遇阻回落至3328。 事实上,不想参与xauusd。昨天到了大日均介入价,遂观察进场。持有黄金,实属白银被动跟盘,便于观察于是持有。 个人看3343附近将成为阻力点,有效放量突破3343-3354阻力带,多头将获得上攻收复3360-3370动力,但还是要突破站稳3370才是看跌减退。只能说,路阻且长。乐观来看,从3395-3300的反弹减弱了极度看空势头,守住不继续下破,是有反弹延续的可能。(纯纯废话)说点有用的,那么,只要不继续向下延伸3300,多头期权在押注335由rutayo0725提供已更新
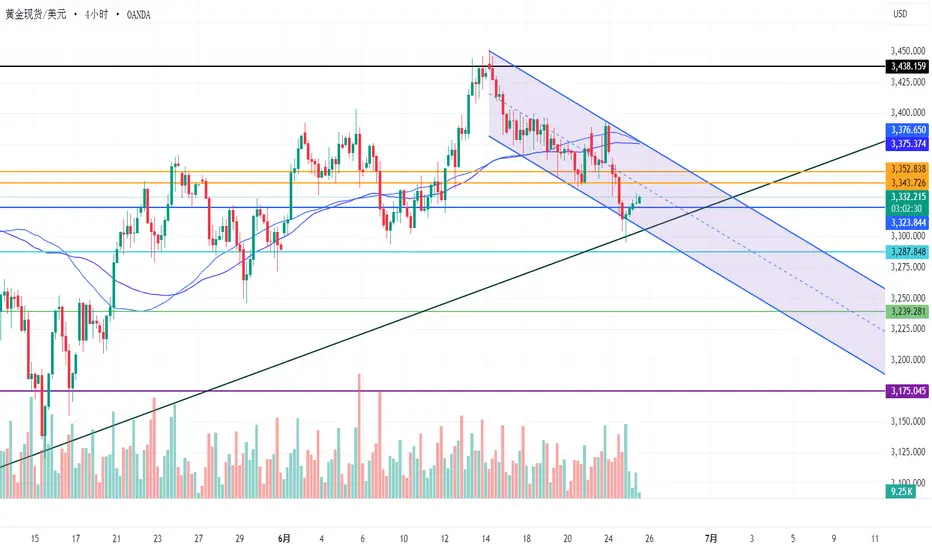
黄金市场分析与评论 - [6月23日 - 6月27日]本周,金价 OANDA:XAUUSD 开盘报3,369美元/盎司,随后在3,340美元至3,374美元/盎司之间窄幅波动,最终收于3,368美元/盎司。本周金价收盘接近开盘价,反映出投资者对当前形势的犹豫。 本周金价持续窄幅波动的原因是,尽管以伊冲突仍在持续,美国总统唐纳德·特朗普仍给予伊朗两周的期限,要求其考虑通过谈判结束与以色列的冲突。 其他方面,6月12日,美联储维持利率在4.25%至4.5%之间不变,同时下调了美国GDP增长预期,并上调了近期通胀预期。美联储主席杰罗姆·鲍威尔承认,关税将推高物价,并对经济活动造成压力。尽管预计年底前还将再次降息两次,但鲍威尔表示,美联储可能会做多由Xayah_trading提供已更新
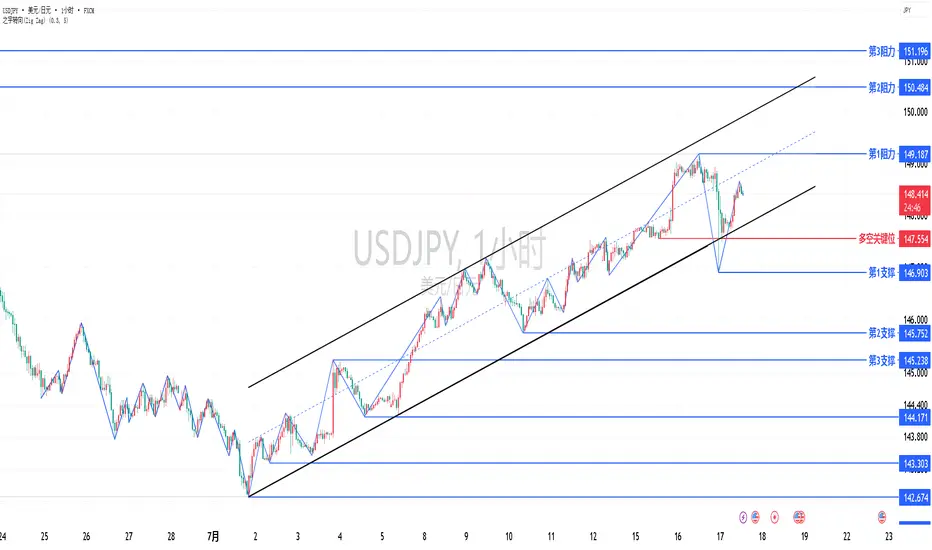
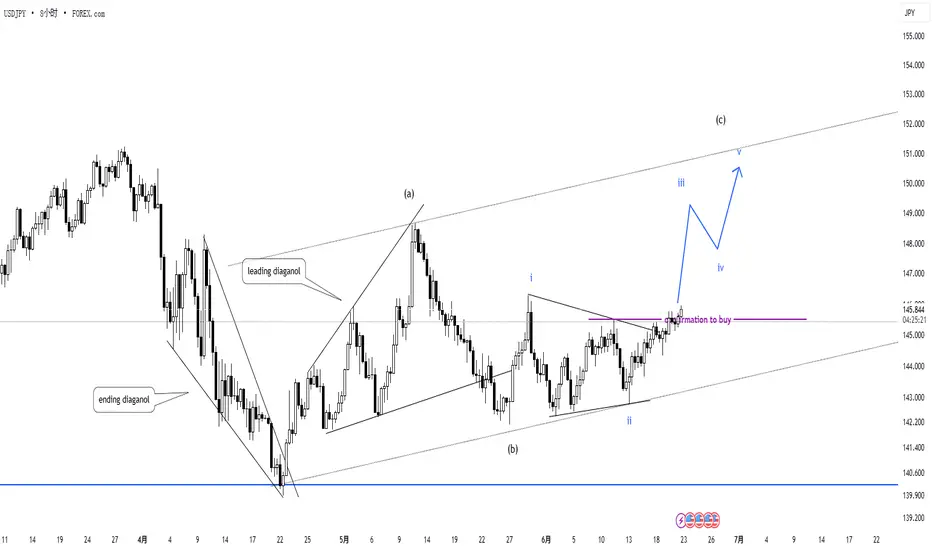
USDJPY h4搭配D1規劃(h4圖面塞不下用h8代替) 20250620其實這張多單我認爲儅級別的論述比較薄弱,但是借由大級別的關鍵價位來做論述上的補足 已經知道比較偏逆儅級別市長主方向的操作,也很有可能做到大級別的整理段,但是這些都是等行情走出來后才會知道的事情,但我會有預先準備好加快移動止損,并且鎖定好獲利空間就是到通道頂部 從d1可以看得出來,最强烈的一段下跌基本上把左邊多方的成本價位破完,回測後續走出的市場結構也偏向空方回測,并且再次向下突破,但目前行情都被撐在同一個非常有價值的關鍵價位 由StayHungryNHumble提供
交易教学:123法则高频之一的入场策略就是它了 在没有方向的一头雾水时,用它入场就简单多了,还能确保不错的胜率 如果在大空间反转时,用它就可以去捕捉高盈亏比的机会 总之,化繁为简,一根趋势线和一根颈线就能把交易做成,所以强烈推荐!教学由motion_7提供
《价格运动消耗原理》第五集 之 跳出稳定亏损的终极答案!!!希望每一个同路人都能凑齐自己的拼图 构建出自己的体系 与市场循环同步运作 打通交易市场的根本 就在于 画图思维 +过程示范+独立决策训练 反思总结出 自己人性的规律 不断的重复这个循环。 你一定会成为稳定盈利的选手 见众生取舍之相 见市场变化之有常 见己贪忧悲思苦的触发规律 你不了解你自己 你就无法超越你自己 都明白了 你就已经在路上了 教学由Cutie5xau提供
《价格运动消耗原理》第四集 之 交易市场人性图谱 现象演变刺激贪婪和恐惧横盘突破时 拥有底仓的你 期待浮动盈利变多 过于期待=过于在意 过于在意=动作变形的开始 变多太多 开始责怪买的少了 这叫贪婪 变多很少 开始责怪买的多了 这叫没有耐心 没有底仓的你 怕上不了车 一去不复返 如果不是专门研究突破与假突破的流派 开始现价硬追 这叫恐惧驱动 在市场经历风雨的你。终于明白 只想着钱的人是赚不到钱的 你要学会思考 要看见这一时刻 身旁那些贪婪和恐惧的人会如何取舍 如何给定止损 你要想着 如果是你来画图 诱导让别人参与 再让对方出局 要怎么画 我想那才是你该做的交易计划 教学由Cutie5xau提供
上证综合指数 000001 做多美国大选和美联储降息周期对全球资本市场会产生多方面的影响,对中国股市的影响主要包括以下几个方面: 1. 积极影响: - 资金流入推动股价上涨:美联储降息后,全球资金流动性增加,部分资金可能会流入中国股市。这有助于增加股市的资金供给,提高市场整体的交易活跃度。并且,随着人民币升值预期增强,外资回流人民币资产的意愿也会提升,进一步为中国股市带来增量资金,推动股价上涨。 - 企业盈利预期改善:降息通常意味着企业的融资成本降低,对于那些依赖外部融资的中国企业来说是一大利好,有助于提高企业的盈利水平和业绩表现。这会增强投资者对股市的信心,推动股市估值上升,尤其是对于一些高负债、资金密集型的企业,如制教学由Jasmine-Flower提供
创业板指数 399006 看涨美联储非农数据以及各国央行发布的经济数据对股市、房地产、投资、消费和各大资产有着广泛且重要的影响,以下是具体分析及实际案例: 1. 对股市的影响: - 积极影响方面:强劲的非农数据通常意味着美国经济形势良好,企业盈利前景乐观,这会增强投资者对股市的信心,推动股市上涨。例如,2022 年美国非农就业数据在一段时间内表现较好,就业人数增加,失业率下降,这在一定程度上支撑了美国股市的稳定。标普 500 指数等主要股指在经济数据向好的阶段保持了相对稳定的走势。 - 消极影响方面:如果非农数据远超预期,市场可能会担心美联储采取紧缩的货币政策,比如加息或减少资产购买计划等,这会增加企业的融资成本,抑制教学由Jasmine-Flower提供
交易分享 - 再提止损的意义和原理有小伙伴还是对止损有点模糊 ~ 再发布一遍 重仓交易,不带止损,基本可以带走95%的人,早晚而已,只是时间的问题,不要心存侥幸。 市场不仁,以所有交易者为刍狗。 其实人生也是一场面对各种风险和不确定性的旅行~ 人生也有很多的止损,不值得的朋友,不值得的ta ~ 不值得的关系,不值得的花~ 下一站总会有更美的花 教学由AryaShi_提供
3月28日黄金一定不要轻易下单做决策真的现在还不是时候,美元也涨,地缘危机也在升级。 条件非常复杂和难判断, 所以一定要等这波拉起来的关键水平价破下去,高位做空比较有概率。01:54由QiLin-Trader-SH提供
Crowding model ║ BullVision🔬 Overview The Crypto Crowding Model Pro is a sophisticated analytical tool designed to visualize and quantify market conditions across multiple cryptocurrencies. By leveraging Relative Strength Index (RSI) and Z-score calculations, this indicator provides traders with an intuitive and detailed snPine Script®指标由BullVisionCapital提供已更新 66292
Dynamic Gap Probability ToolDynamic Gap Probability Tool measures the percentage gap between price and a chosen moving average, then analyzes your chart history to estimate the likelihood of the next candle moving up or down. It dynamically adjusts its sample size to ensure statistical robustness while focusing on the exact dePine Script®指标由Julien_Eche提供99500
EVaR Indicator and Position SizingThe Problem: Financial markets consistently show "fat-tailed" distributions where extreme events occur with higher frequency than predicted by normal distributions (Gaussian or even log-normal). These fat tails manifest in sudden price crashes, volatility spikes, and black swan events that traditiPine Script®指标由HenriqueCentieiro提供已更新 1515285
Divergence Screener [Trendoscope®]🎲Overview The Divergence Screener is a powerful TradingView indicator designed to detect and visualize bullish and bearish divergences, including hidden divergences, between price action and a user-selected oscillator. Built with flexibility in mind, it allows traders to customize the oscillator Pine Script®指标由Trendoscope提供已更新 66 1.4 K
Logarithmic Moving Average (LMA) [QuantAlgo]🟢 Overview The Logarithmic Moving Average (LMA) uses advanced logarithmic weighting to create a dynamic trend-following indicator that prioritizes recent price action while maintaining statistical significance. Unlike traditional moving averages that use linear or exponential weights, this indicPine Script®指标由QuantAlgo提供1515 1 K
Volumatic Support/Resistance Levels [BigBeluga]🔵 OVERVIEW A smart volume-powered tool for identifying key support and resistance zones—enhanced with real-time volume histogram fills and high-volume markers. Volumatic Support/Resistance Levels detects structural levels from swing highs and lows, and wraps them in dynamic histograms that rePine Script®指标由BigBeluga提供77 2.2 K
True Close – Institutional Trading Sessions (Zeiierman)█ Overview True Close – Institutional Trading Sessions (Zeiierman) is a professional-grade session mapping tool designed to help traders align with how institutions perceive the market’s true close. Unlike the textbook “daily close” used by retail traders, institutional desks often anchor their Pine Script®指标由Zeiierman提供已更新 2323 1.3 K
Open Interest Footprint IQ [TradingIQ]Hello Traders! Th e Open Interest Footprint IQ indicator is an advanced visualization tool designed for cryptocurrency markets. It provides a granular, real-time breakdown of open interest changes across different price levels, allowing traders to see how aggressive market participation is distribuPine Script®指标由Trading-IQ提供1212944
Zigzag CandlesCan't deny that I am obsessed with zigzags. Been doing some crazy experiments with it and have many more in pipeline. I believe zigzag can be used to derive better trend following methods. Here is an attempt to visualize zigzag as candlesticks. Next steps probably to derive moving average, atr (althPine Script®指标由Trendoscope提供已更新 1313 1 K
MathStatisticsKernelFunctionsLibrary "MathStatisticsKernelFunctions" TODO: add library description here uniform(distance, bandwidth) Uniform kernel. Parameters: distance : float, distance to kernel origin. bandwidth : float, default=1.0, bandwidth limiter to weight the kernel. Returns: float. triangular(distancePine Script®库由RicardoSantos提供4470


 做多
做多

 做多
做多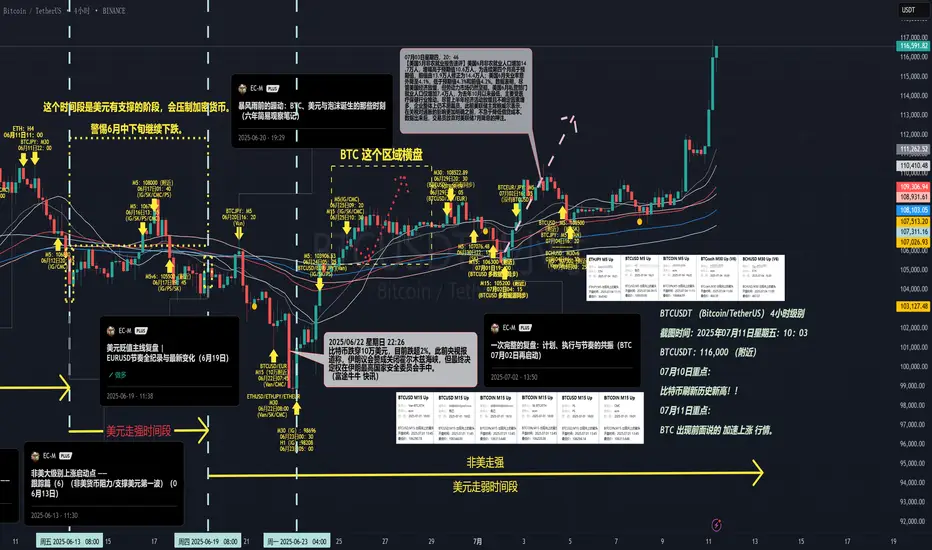

 做多
做多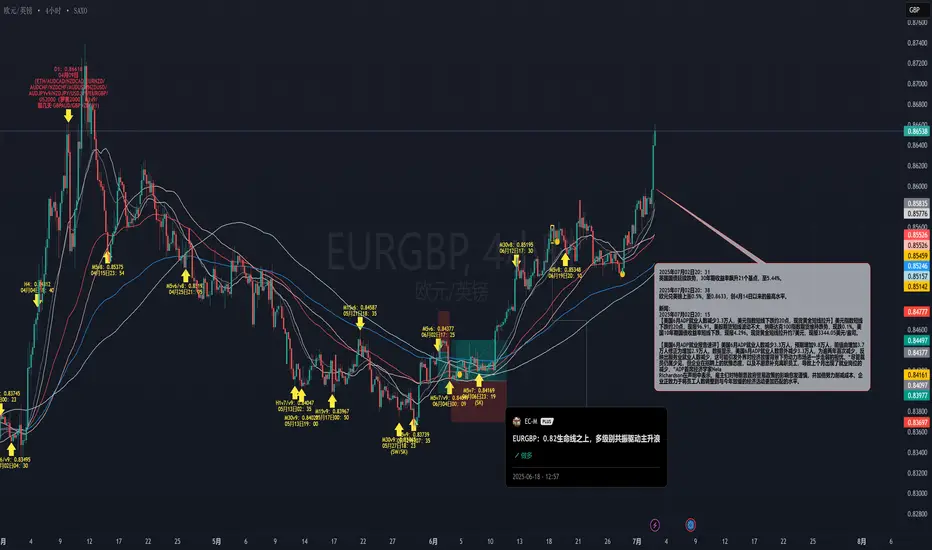
 做空
做空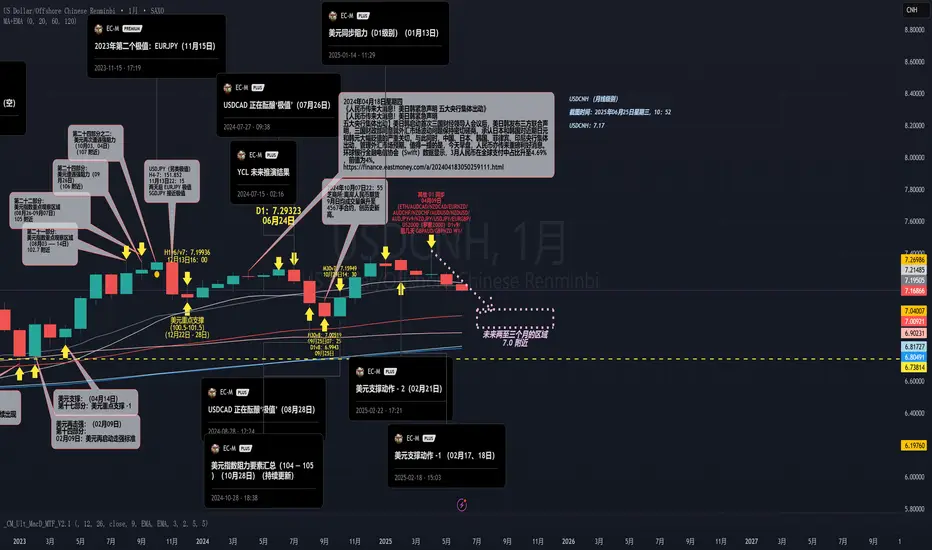
 做多
做多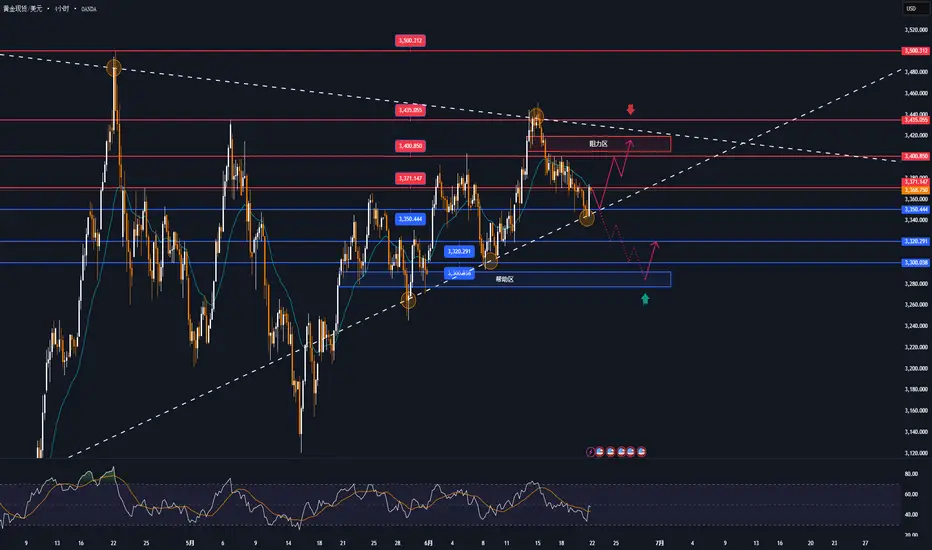
 教学
教学 教学
教学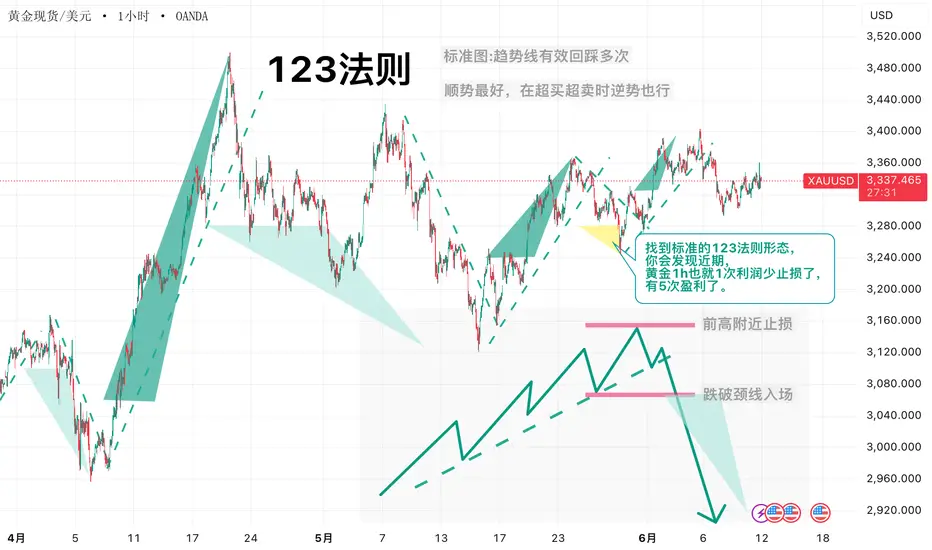 教学
教学 教学
教学 教学
教学
 教学
教学
 教学
教学 教学
教学
 教学
教学 教学
教学


